Exam Code: CBDA (Practice Exam Latest Test Questions VCE PDF)
Exam Name: Certification in Business Data Analytics (IIBA - CBDA)
Certification Provider: IIBA
Free Today! Guaranteed Training- Pass CBDA Exam.
Online IIBA CBDA free dumps demo Below:
NEW QUESTION 1
A large number of text messages are received by Twitter each year making Twitter one example of Big Data. What data characteristic represents this large number of text messages?
- A. Veracity
- B. Velocity
- C. Value
- D. Variety
Answer: B
Explanation:
Velocity is one of the four V??s of Big Data, along with Volume, Variety, and Veracity. Velocity refers to the speed at which data is generated, collected, and processed. A large number of text messages received by Twitter each year is an example of high- velocity data, as it requires real-time or near-real-time processing and analysis to extract insights and value from it. High-velocity data poses challenges and opportunities for business data analytics, as it requires efficient and scalable data infrastructure, streaming analytics, and timely decision-making.
References:1, page 9; 2, page 6.
NEW QUESTION 2
The architecture team puts forth a solution architecture that integrates multiple data sources from within and outside the organization. The architecture provides the foundation to source a new analytics program. If one of the objectives of the analytics team was to provide 'one source of the truth', this objective would be referring to which of the following?
- A. Identifying one key stakeholder, who can make final decisions about which sources to relate/merge
- B. Evaluating the completeness, validity, and reliability of the data from source systems
- C. Ensuring stakeholders always have clear insight into the final requirements at all times
- D. Enforcing master data management principles and practices
Answer: D
Explanation:
Providing ??one source of the truth?? means ensuring that there is a single, consistent, and authoritative source of data that can be used for analytics and decision making across the organization. This objective can be achieved by enforcing master data management principles and practices, which involve defining, governing, and maintaining the quality and integrity of the core data entities that are shared by multiple systems and processes. Master data management helps to eliminate data silos, reduce data duplication and inconsistency, and improve data accuracy and reliability12 References: 1: What is Master Data Management (MDM)? - Informatica 2: Master Data Management - IIBA BABOK Guide v3
NEW QUESTION 3
The data analysis completed by the analytics team points to three potential options that could be recommended by the team each of which will help their organization meet their desired goal. Given that there is no significant difference in the results that each option would provide, the team will reach a final recommendation by determining value to be delivered to specific parts of the organization and:
- A. Within the functional unit with the most staff
- B. By which manager wants the change the most
- C. Assessing the impact of change for each one
- D. By optaining a decision by senior management
Answer: C
Explanation:
According to the IIBA??s Guide to Business Data Analytics, one of the steps in the data analysis process is to use the results to influence business decision making. This involves evaluating the feasibility, viability, and desirability of the potential options or solutions that are derived from the data analysis, and recommending the best option or solution that aligns with the business goals and objectives1. To evaluate the feasibility, viability, and desirability of the options or solutions, the data analysis team should consider the value to be delivered to specific parts of the organization and the impact of change for each one. The value to be delivered refers to the benefits, outcomes, or improvements that the option or solution will provide to the stakeholders, customers, or processes of the organization. The impact of change refers to the costs, risks, or challenges that the option or solution will entail for the implementation, adoption, or maintenance of the organization. By assessing the value and the impact of each option or solution, the data analysis team can compare and contrast the trade-offs, pros and cons, and strengths and weaknesses of each option or solution, and select the one that maximizes the value and minimizes the impact for the organization2.
The other options are not correct criteria for reaching a final recommendation. The functional unit with the most staff, the manager who wants the change the most, and the senior management are not relevant factors for evaluating the options or solutions, as they do not reflect the value or the impact of the options or solutions. The functional unit with the most staff may not be the most affected or the most important part of the organization for the data analysis project. The manager who wants the change the most may not have the authority, influence, or expertise to make the best decision for the organization. The senior management may not be the only or the final decision makers for the data analysis project, as they may delegate, consult, or collaborate with other stakeholders or experts. References:1: Guide to Business Data Analytics, IIBA, 2020, p. 572: Guide to Business Data Analytics, IIBA, 2020, p. 58. : Guide to Business Data Analytics, IIBA, 2020, p. 57. : Guide to Business Data Analytics, IIBA, 2020, p. 58.
NEW QUESTION 4
To gain traction on online sales, a retailer initiated a marketing campaign using banner ads. The company has requested their analytics team to evaluate the performance of the campaign. During the presentation, the analyst confirmed that the campaign did bring in a large number of net new customers to the website and met the target sales conversion rate. They also noted that there was a high number of repeat visitors not completing a sale. What decision would help the retailer improve sales conversion rates for repeat visitors?
- A. Increase investment in banner ads
- B. Incentivize customers to subscribe to promotional notifications
- C. Add additional new products to attract customers
- D. Ensure the sales checkout process is streamlined
Answer: D
Explanation:
According to the Business Data Analytics: A Decision-Making Paradigm1, one of the key steps in the analytics process is to communicate insights and recommendations to stakeholders. The analyst should present the findings in a clear and concise manner, and provide actionable suggestions to improve the business outcomes. In this case, the analyst has identified that repeat visitors are not completing a sale, which indicates a possible issue with the sales checkout process. Therefore, the analyst should recommend the retailer to streamline the sales checkout process, which could reduce friction, increase customer satisfaction, and boost sales conversion rates for repeat visitors. References: Business Data Analytics: A Decision-Making Paradigm
NEW QUESTION 5
A database analyst is modelling a database for a large toy manufacturer. Which statement describes a logical database model?
- A. The layer of views created to summarize data or provide another perspective of certain data
- B. A model that depicts the actual design of the relational database
- C. An abstraction of the conceptual data model that includes rules of normalization
- D. Modelling that involves objects being defined at the schema level
Answer: C
Explanation:
A logical database model is a data model of a specific problem domain expressed independently of a particular database management product or storage technology. It describes data using notation that corresponds to a data organization used by a database management system, such as relational tables and columns. It also includes rules of normalization, which are the process of converting complex data structures into simple, stable data structures12 References: 1: Logical schema - Wikipedia 2: What Is a Data Model? | Coursera
NEW QUESTION 6
An analyst is tasked with helping the sales team make better use of its data to support informed business decision making. The analyst creates the following research question 'How can shipping costs be lowered in the northeast to remain competitive?'.This question:
- A. Is sufficient to begin analytics work and can be revised after analysis
- B. Is adequately stated and scopes the analytics initiative
- C. Needs to be further defined before mathematical modeling can begin
- D. Needs to be more broadly focused to frame the research
Answer: C
Explanation:
According to the Guide to Business Data Analytics, a research question is a clear, concise, and specific question that guides the analytics work1. The research question should be SMART: Specific, Measurable, Achievable, Relevant, and Time- bound2. The question ??How can shipping costs be lowered in the northeast to remain competitive??? is not SMART, as it lacks some important details, such as:
✑ What is the current shipping cost and the target cost reduction?
✑ What are the criteria for measuring competitiveness?
✑ What is the time frame for achieving the cost reduction and competitiveness?
✑ What are the factors that influence the shipping cost and competitiveness?
✑ What are the assumptions and constraints of the analysis? Therefore, the question
needs to be further defined before mathematical modeling can begin, as the modeling requires clear and precise inputs and outputs. The other options are not correct, as they imply that the question is either too vague or too narrow, which is not the case.
References:1: Guide to Business Data Analytics, IIBA, 2020, p. 312: Introduction to Business Data Analytics: A Practitioner View, IIBA, 2019, p. 11.
NEW QUESTION 7
With the recent departure of two of its employees, an IT helpdesk team is now understaffed and finding it difficult to keep up with the current workload. The number of tickets being received has increased as well as the number of days to resolve the tickets. The IT manager has set up a meeting with the IT director to request funding for two new helpdesk agents. To prepare for the meeting, the manager is interested in showing the tickets processed against ticket volume over the past year. What type of chart should the manager use to effectively show the change in processing rate over time?
- A. A pie chart to compare the number of tickets coming in versus tickets being processed each month, over the past year
- B. A column chart to compare the number of tickets coming in versus tickets being processed each month, since June
- C. A line chart to show the widening gap between the number of tickets being processed against the number coming over the past year
- D. A waterfall chart to show the number of tickets coming in are a lot higher than those being processed as of year to date
Answer: C
Explanation:
A line chart is the type of chart that the manager should use to effectively show the change in processing rate over time, because it is a technique that displays data as a series of points connected by straight lines. A line chart can help the manager visualize the trends and patterns in the ticket volume and processing rate over the past year, and highlight the widening gap between them. A line chart can also show the seasonal variations and fluctuations in the data, and compare the performance of different categories or groups. Options A, B, and D are not suitable for showing the change in processing rate over time, because they are techniques that display data as proportions (A), comparisons (B), or accumulations (D) of different categories or groups at a single point in time or over a fixed period. References:
•Business Analysis Certification in Data Analytics, CBDA | IIBA®, CBDA Competencies, Domain 4: Interpret and Report Results
•Understanding the Guide to Business Data Analytics, page 18
•16 Best Types of Charts and Graphs for Data Visualization [+ Guide]
NEW QUESTION 8
A financial software company has growth and expansion as one of their top strategic priorities for the year. The senior executive team would like to assess their sales performance over the last 3 years to help set sales objectives. In discussion with the business analytics manager, for a comprehensive sales report, the sales lead recommends looking into the number of contracts signed over the past 3 years and the dollar value for the signed contracts. Which other question is important to consider when evaluating sales performance?
- A. What is the time to market the software?
- B. What is the total cost incurred per year?
- C. What is the number of customers retained over the past 3 years?
- D. What is the average time for conversion?
Answer: D
Explanation:
The average time for conversion is the average number of days it takes to convert a lead into a customer. This is an important question to consider when evaluating sales performance, because it indicates the efficiency and effectiveness of the sales process. A shorter time for conversion means that the sales team can close more deals in less time, and thus increase the revenue and profitability of the company. A longer time for conversion may indicate that there are bottlenecks, challenges, or inefficiencies in the sales process that need to be addressed. References:
•Business Analysis Certification in Data Analytics, CBDA | IIBA®, CBDA Competencies, Domain 5: Use Results to Influence Business Decision Making
•Understanding the Guide to Business Data Analytics, page 9
•Business Data Analytics (IIBA®-CBDA Exam preparation) | Udemy, Section 4: Interpret and Report Results, Lecture 19: Sales Performance Metrics
NEW QUESTION 9
While formulating the results from completed analysis, the analytics team is applying different techniques to determine an optimal solution to the specified business problem. Which of the following runs the risk of introducing bias in their decision making process?
- A. Evidenced-based decision making
- B. Expert judgement and experience
- C. Correlations identified through artificial intelligence
- D. Letting the data tell the story
Answer: B
Explanation:
Expert judgement and experience are valuable sources of knowledge and insight for business data analytics, but they can also introduce bias in the decision making process. Bias is a tendency to favor or reject a certain perspective, outcome, or solution based on personal or subjective preferences, beliefs, or expectations. Bias can affect the quality, validity, and reliability of the data analysis and the resulting decisions. Some examples of bias that can affect expert judgement and experience are confirmation bias, availability bias, anchoring bias, and overconfidence bias. To avoid or minimize bias, business data analysts should apply critical thinking, data literacy, and ethical principles throughout the data analysis process. They should also seek diverse perspectives, challenge assumptions, validate findings, and communicate uncertainties and limitations. References:10 Cognitive Biases in Business Analytics and How to Avoid Them; Business Data Analytics: A Decision-Making Paradigm, page 8; Guide to Business Data Analytics, page 11.
NEW QUESTION 10
A manufacturing company, specializing in turf maintenance equipment, has recently seen a decline in their lawn mower sales. As a result, the analytics team is asked to review the latest customer satisfaction survey results. An analyst on this team creates a report for senior management with attractive visuals, supported by the KPI results. Upon reviewing the report, the analyst's manager mentions that the report is missing the narrative. What does this mean?
- A. The data tables that support the visuals and help answer questions
- B. A narrative that supports insights with additional context and draws correlations
- C. Notes on assumptions and unavailable data for analysis
- D. Commentary around why each graphic was selected to provide additional context
Answer: B
Explanation:
A narrative is a written or spoken explanation of the data analysis results that tells a story with the data, provides additional context and background information, highlights the key insights and findings, and draws correlations and implications for the decision makers12. The report is missing the narrative, meaning that it does not communicate the meaning and value of the data analysis effectively, and it leaves the interpretation and action to the senior management without any guidance or recommendation34. References: 1: Guide to Business Data Analytics, IIBA, 2020, p. 672: Storytelling with Data, Cole Nussbaumer Knaflic, 2015, p. 93: Data Storytelling: The Essential Data Science Skill Everyone Needs, Brent Dykes, 2016, 14: The Power of Data Storytelling, Harvard Business Review, 2018, 2.
NEW QUESTION 11
An insurance company has seen an upward trend in winter-related accidents over the past three years. The company has just completed an analytics study to better understand the primary reasons for these accidents and assess how many of the drivers were using winter tires. This analysis will help the company decide how to move forward with drivers not taking precautionary measures during winter. What type of analysis will help in determining the primary reasons and percentage of those drivers with winter tires?
- A. Prescriptive
- B. Descriptive and Predictive
- C. Descriptive
- D. Descriptive and Diagnostic
Answer: D
Explanation:
Descriptive analytics is a type of analytics that summarizes and visualizes the data to provide an overview of what has happened or is happening, such as the trend of winter- related accidents over the past three years, or the percentage of drivers using winter tires12. Diagnostic analytics is a type of analytics that explores and analyzes the data to understand why something has happened or is happening, such as the primary reasons for these accidents, or the factors that influence the drivers?? decisions13. To answer the question, both descriptive and diagnostic analytics would be needed to provide the relevant information and insights for the company. References: 1: Guide to Business Data Analytics, IIBA, 2020, p. 182: Business Analytics: Data Analysis & Decision Making, S. Christian Albright and Wayne L. Winston, 2015, p. 53: Data Science for Business, Foster Provost and Tom Fawcett, 2013, p. 13.
NEW QUESTION 12
An analyst is interested in providing a visual diagram to compare and contrast the characteristics of four different solution options. Each option should be represented by their cost, value, and risk level. What type of chart would accomplish this task?
- A. Bubble
- B. Waterfall
- C. Pie
- D. Bullet
Answer: A
Explanation:
A bubble chart is a type of chart that displays three dimensions of data: the x-axis, the y-axis, and the size of the bubble. A bubble chart can be used to compare and contrast the characteristics of different solution options by plotting their cost, value, and risk level on the three axes. For example, a solution option with a high cost, high value, and low risk would be represented by a large bubble on the upper left corner of the chart, while a solution option with a low cost, low value, and high risk would be represented by a small bubble on the lower right corner of the chart. A bubble chart can help the analyst and the stakeholders to visualize the trade-offs and benefits of each solution option and to select
the most optimal one based on the business objectives and constraints. References: Guide to Business Data Analytics, page 77; Introduction to Business Data Analytics: A Practitioner View, page 16; [Business Data Analytics: A Practical Guide], page 121.
NEW QUESTION 13
A consumer goods manufacturer has recently completed an analytics study to understand how to improve its operational excellence. From the top highlights, online sales outperformed other channels in sales growth and there was a direct relationship between positive customer reviews and increased internet sales. Which strategic business decision may be logically derived from these results?
- A. Improve quality of the products
- B. Create an empowered and collaborative work culture
- C. Encourage customers to complete online reviews
- D. Improve operational efficiencies
Answer: C
Explanation:
The strategic business decision that may be logically derived from the results is to encourage customers to complete online reviews, because the results show that there is a direct relationship between positive customer reviews and increased internet sales. By increasing the number and quality of online reviews, the consumer goods manufacturer can boost its online sales performance, which outperformed other channels in sales growth. Online reviews can also help the manufacturer gain customer feedback, improve customer loyalty, and enhance its brand reputation. References:
•Business Analysis Certification in Data Analytics, CBDA | IIBA®, CBDA Competencies, Domain 5: Use Results to Influence Business Decision Making
•Understanding the Guide to Business Data Analytics, page 9
•CERTIFICATION IN BUSINESS DATA ANALYTICS HANDBOOK - IIBA®, page 8, CBDA
Exam Sample Questions and Self-Assessment, Question 6
NEW QUESTION 14
The analytics team has been asked to provide an estimate of the number of customers they expect to have in 12 months. They debated how accurate that figure needs to be and determined that based on the availability of good data, they could predict within + or - 10%. This is an example of a:
- A. ROM estimate
- B. Delphi estimate
- C. Parametric estimate
- D. Definitive estimate
Answer: A
Explanation:
A ROM estimate is a rough order of magnitude estimate that provides a quick and approximate estimate of the cost, time, or effort required for a project or a task. A ROM estimate is based on expert opinion or experience from past projects, and it usually has a large range of variation, such as + or - 10%. A ROM estimate is useful when there is limited information or data available, or when a high-level estimate is needed for planning or budgeting purposes. However, a ROM estimate also has a high degree of uncertainty and variability, and it should be refined as more details become available12 References: 1: Project Estimation Techniques Business Analysts Should Know About 2: Estimation techniques for business analysts – The Functional BA
NEW QUESTION 15
DIAGRAM TAKEN
A data scientist is analyzing a dataset to determine if there is a strong relationship between twovariables. A measure of covariance is done. Which of the following graphs indicate Zero Covariance between variables?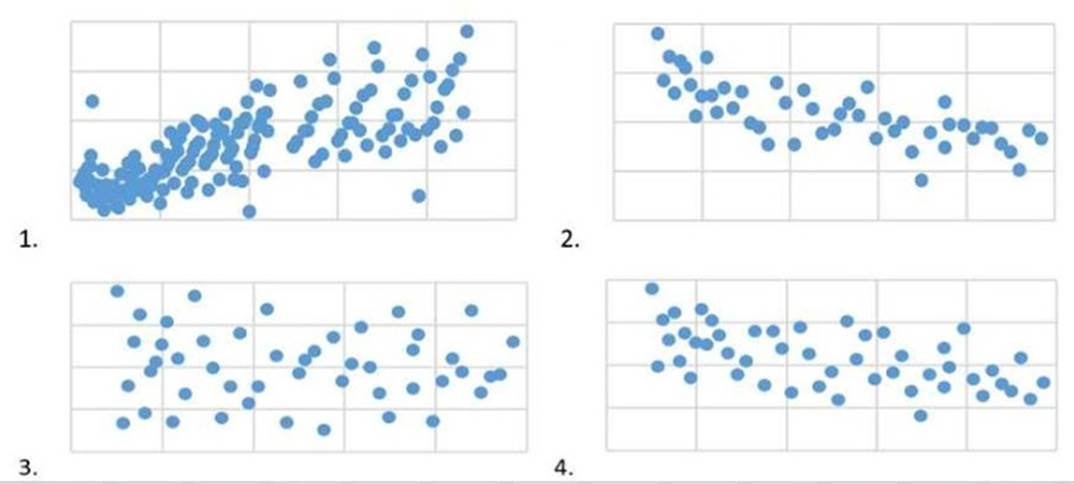
- A. 3
- B. 1
- C. 4
- D. 2
Answer: C
Explanation:
In the context of Business Data Analytics (IIBA®- CBDA), zero covariance between two variables indicates that there is no linear relationship between those variables. When the covariance is zero, it means the variables are independent of each other. In the provided options, graph 4 shows a random scatter of data points without any apparent trend or pattern, indicating zero covariance.
References: The explanation is in alignment with the concepts and principles outlined in IIBA??s resources on Business Data Analytics, particularly focusing on statistical analysis and data interpretation.
NEW QUESTION 16
......
100% Valid and Newest Version CBDA Questions & Answers shared by Allfreedumps.com, Get Full Dumps HERE: https://www.allfreedumps.com/CBDA-dumps.html (New 150 Q&As)
