Proper study guides for Rebirth Microsoft Analyzing Data with Microsoft Power BI certified begins with Microsoft DA-100 preparation products which designed to deliver the Top Quality DA-100 questions by making you pass the DA-100 test at your first time. Try the free DA-100 demo right now.
Online Microsoft DA-100 free dumps demo Below:
NEW QUESTION 1
You plan to create the chart shown in the following exhibit.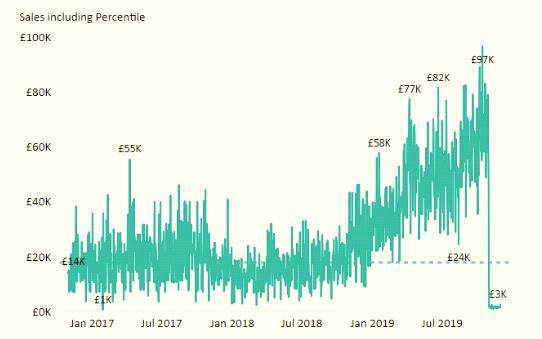
How should you create the dashed horizontal line denoting the 40th percentile of daily sales for the period shown?
- A. Create a horizontal line that has a fixed value of 24,000.
- B. Add a measure to the visual that uses the following DAX expression.Heasurel - PERCENTUEX.EXC (Sales,Sales[Total Sales],©.40)
- C. Add a new percentile line that uses Total Sales as the measure and 40% as the percentile.
- D. Add a measure to the visual that uses the following DAX expression.Heasurel = PERCENTILEX.INC (Sales,Sales[Total Sales],6.40)
Answer: D
NEW QUESTION 2
You have a Microsoft Power Bl report. The size of PBIX file is 550 MB. The report is accessed by using an App workspace in shared capacity of powerbi.com.
The report uses an imported dataset that contains one fact table. The fact table contains 12 million rows. The dataset is scheduled to refresh twice a day at 08:00 and 17:00.
The report is a single page that contains 15 custom visuals and 10 default visuals.
Users say that the report is slow to load the visuals when they access and interact with the report You need to recommend a solution to improve the performance of the report.
What should you recommend?
- A. Split the visuals onto multiple pages.
- B. Implement row-level security (RLS).
- C. Replace the default visuals with custom visuals.
- D. Increase the number of times that the dataset is refreshed.
Answer: A
NEW QUESTION 3
You have a report that contains four pages. Each page contains slicers for the same four fields. Users report dthat when they select values on a slicer on one page, the visuals are not updated on all the pages. You need to recommend a solution to ensure that users can select a value once to filter the results on all the pages. What are two possible recommendations to achieve this goal? Each correct answer presents a complete solution. NOTE: Each correct selection is worth one point.
- A. Sync the slicers across the pages.
- B. Replace the slicers with page-level filters.
- C. Replace the slicers with visual-level filters.
- D. Create a bookmark for each slicer value.
- E. Replace the slicers with report-level filters.
Answer: BD
NEW QUESTION 4
You have four sales regions. Each region has multiple sales managers.
You implement row-level security (RLS) in a data model. You assign the relevant distribution lists to each role.
You have sales reports that enable analysis by region. The sales managers can view the sales records of their region. The sales managers are prevented from viewing records from other regions.
A sales manager changes to a different region.
You need to ensure that the sales manager can see the correct sales data. What should you do?
- A. From Microsoft Power Bl Desktop, edit the Row-Level Security setting for the reports.
- B. Change the Microsoft Power Bl license type of the sales manager.
- C. Manage the permissions of the underlying dataset
- D. Request that the sales manager be added to the correct Azure Active Directory group.
Answer: A
NEW QUESTION 5
You have a data model that contains many complex DAX expressions. The expressions contain frequent
references to the related and relatedtable functions. You need to recommend a solution to minimize the use of the related and relatedtable functions. What should you recommend?
- A. Merge tables by using Power Quer
- B. )
- C. Hide unused columns in the mode
- D. )
- E. Split the model into multiple models.
- F. Transpose.
Answer: A
NEW QUESTION 6
You have a collection of reports for the HR department of your company. The datasets use row-level security (RLS). The company has multiple sales regions that each has an HR manager. You need to ensure that the HR managers can interact with the data from their region only. The HR managers must be prevented from changing the layout of the reports. How should you provision access to the reports for the HR managers?
- A. Create a new workspace, copy the datasets and reports, and add the HR managers as members of the workspace.
- B. Publish the reports to a different workspace other than the one hosting the datasets.
- C. Publish the reports in an app and grant the HR managers access permission.
- D. Add the HR managers as members of the existing workspace that hosts the reports and the datasets.
Answer: D
NEW QUESTION 7
You need to create a visual as shown in the following exhibit.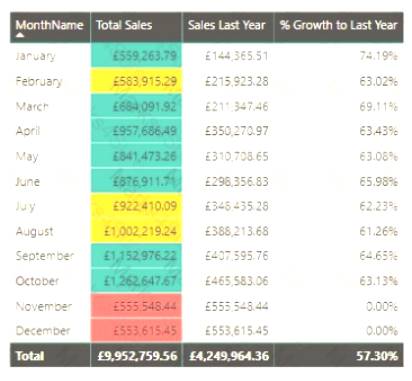
The indicator color for Total Sales will be based on % Growth to Last Year. The solution must use the existing calculations only.
How should you configure the visual? To answer, select the appropriate options in the answer area. NOTE: Each correct selection is worth one point.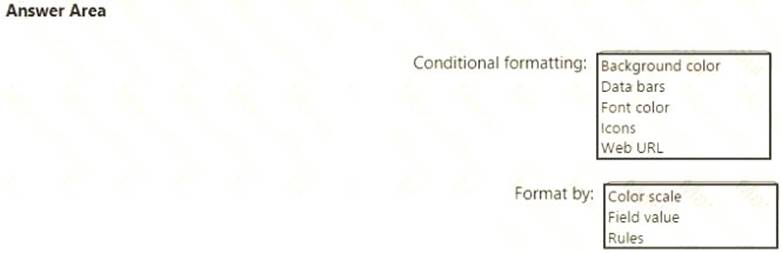
- A. Mastered
- B. Not Mastered
Answer: A
Explanation: 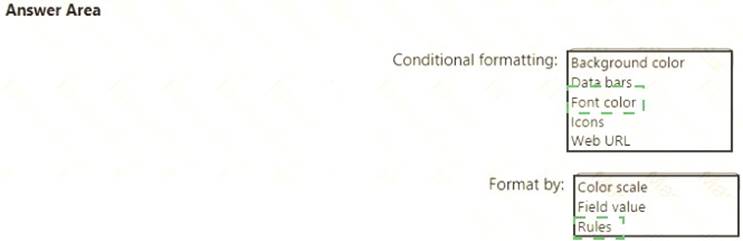
NEW QUESTION 8
You create a dashboard by using the Microsoft Power Bl Service. The dashboard contains a card visual that shows total sales from the current year. You grant users access to the dashboard by using the viewer role on the workspace. A user wants to receive daily notifications of the number shown on the card visual. You need to automate the notifications. What should you do?
- A. Share the dashboard to the user.
- B. Create a subscription.
- C. Create a data alert.
- D. Tag the user in a comment.
Answer: A
NEW QUESTION 9
You are creating a Microsoft Power Bl model that has two tables named CityData and Sales. CityData contains only the data shown in the following table.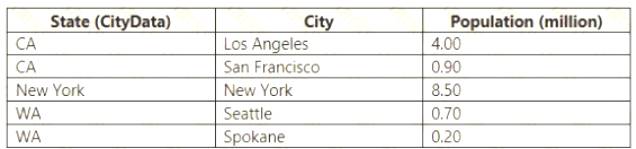
Sales contains only the data shown in the following table.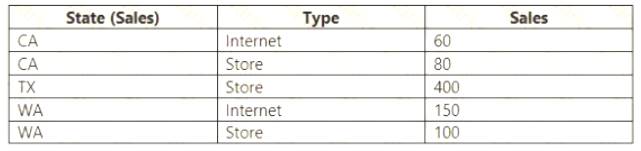
For each of the following statements, select Yes if the statement is true. Otherwise, select No. NOTE: Each correct selection is worth one point.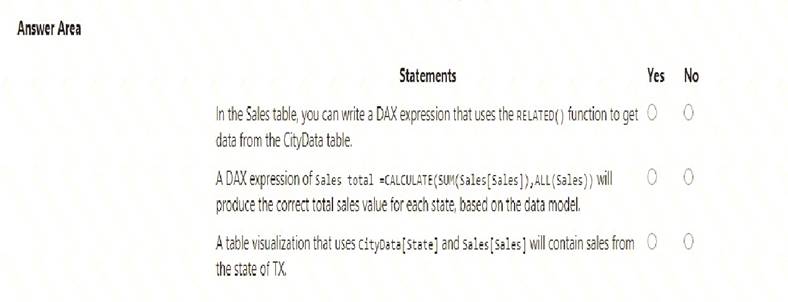
- A. Mastered
- B. Not Mastered
Answer: A
Explanation: 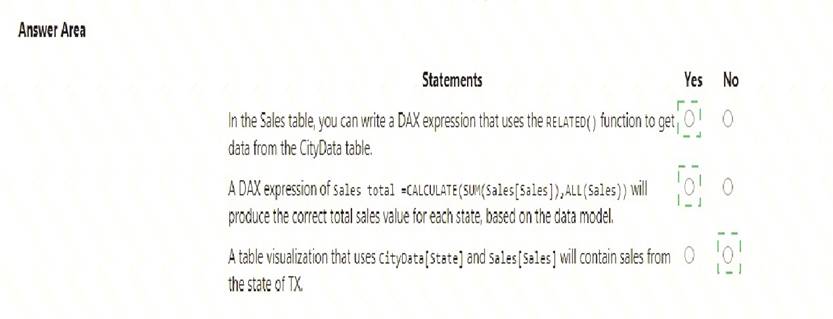
NEW QUESTION 10
You view a query named Transactions as shown in the following exhibit.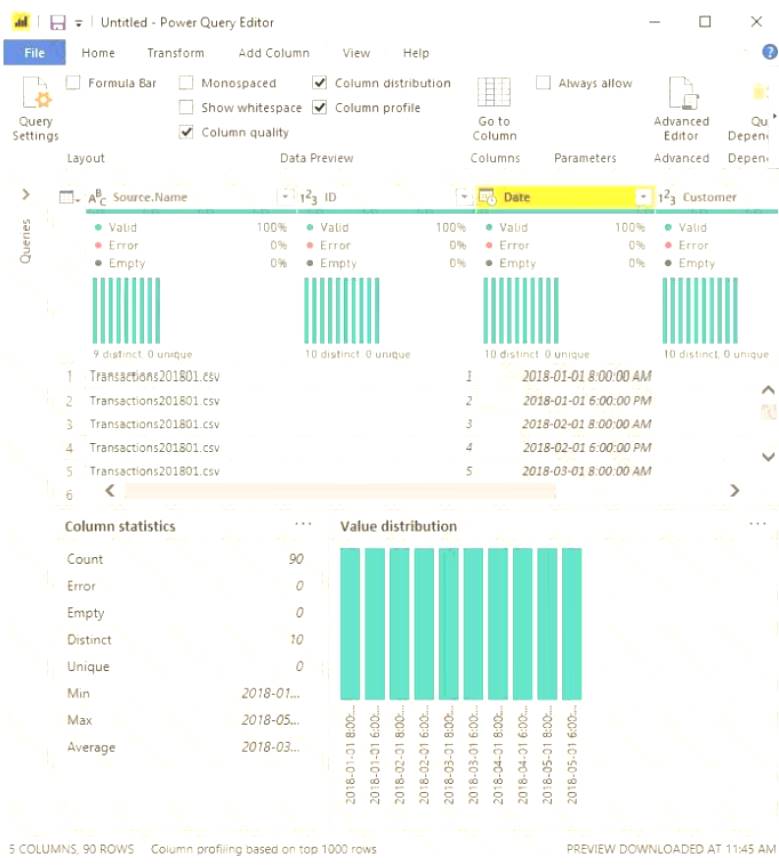
The query gets CSV files from a folder.
Use the drop-down menus to select the answer choice that completes each statement based on the information presented in the graphic.
NOTE: Each correct selection is worth one point.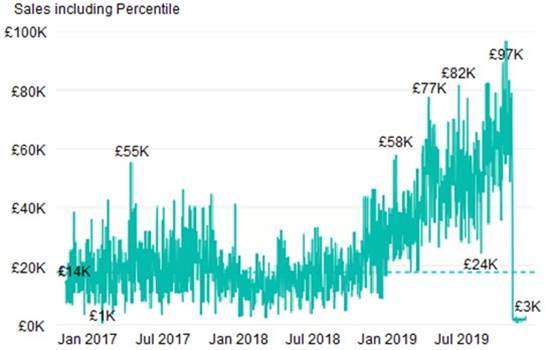
- A. Mastered
- B. Not Mastered
Answer: A
Explanation: 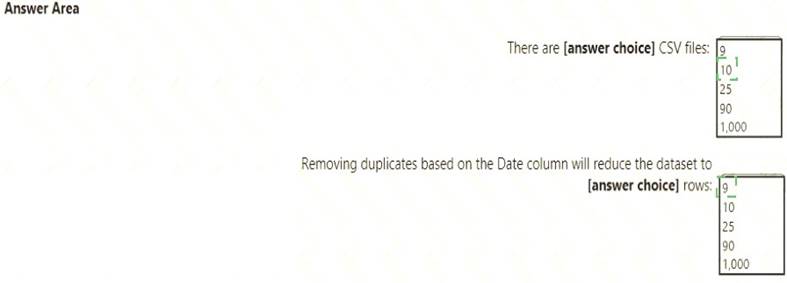
NEW QUESTION 11
You have a report page that contains the visuals shown in the following exhibit.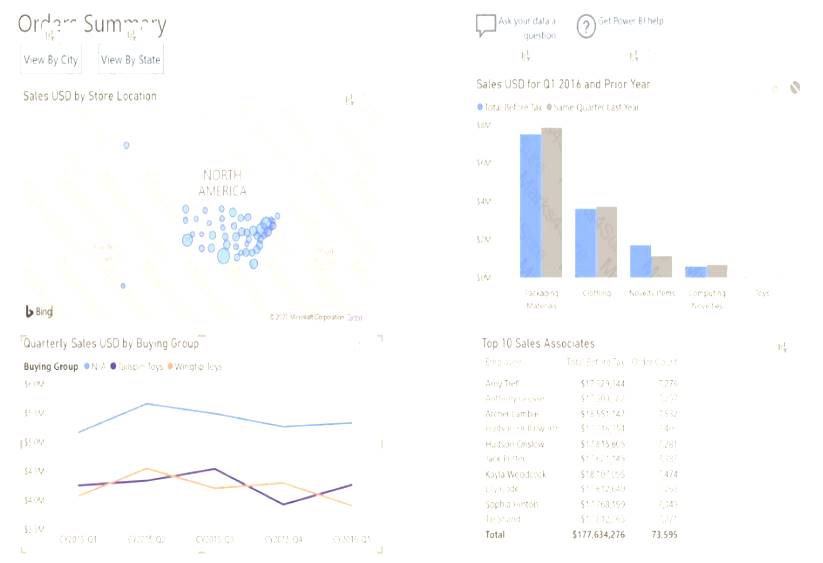
Use the drop-down menus to select the answer choice that completes each statement based on the information presented in the graphic. NOTE: Each correct selection is worth one point.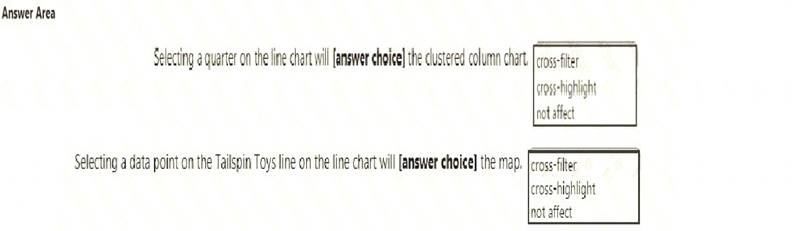
- A. Mastered
- B. Not Mastered
Answer: A
Explanation: 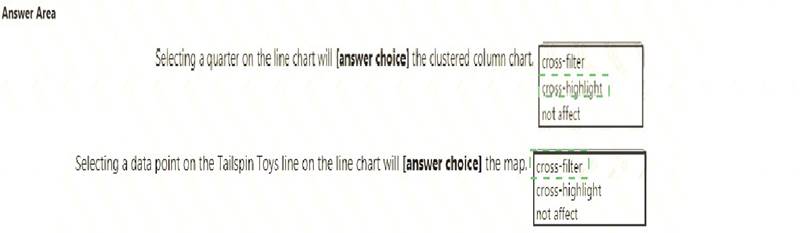
NEW QUESTION 12
You have a Microsoft Power Bl workspace.
You need to grant the user capabilities shown in the following table.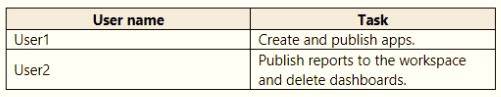
The solution must use the principle of least privilege.
Which user role should you assign to each user? To answer, drag the appropriate roles to the correct users. Each role may be used once, more than once, or not at all. You may need to drag the split bar between panes or scroll to view content.
NOTE: Each correct selection is worth one point.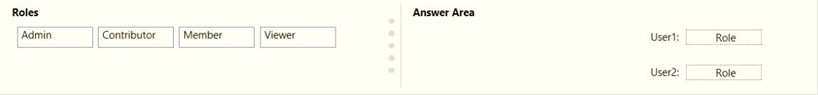
- A. Mastered
- B. Not Mastered
Answer: A
Explanation: 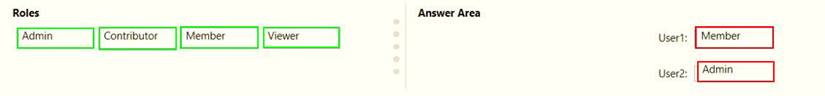
NEW QUESTION 13
You need to address the data concerns before creating the data model. What should you do in Power Query Editor?
- A. Select Column distribution.
- B. Select the sales_amount column and apply a number filter.
- C. Select Column profile, and then select the sales_amount column.
- D. Transform the sales_amount column to replace negative values with 0.
Answer: A
NEW QUESTION 14
You have a table that contains sales data and approximately 1,000 rows. You need to identify outliers in the table. Which type of visualization should you use?
- A. area chart
- B. donut chart
- C. scatter plot
- D. pie chart
Answer: D
NEW QUESTION 15
You need to create a relationship between the Weekly_Returns table and the Date table to meet the reporting requirements of the regional managers. What should you do?
- A. In the Weekly.Returns table, create a new calculated column named date-id in a format of yyyymmdd and use the calculated column to create a relationship to the Date table.
- B. Add the Weekly_Returns data to the Sales table by using related DAX functions.
- C. Create a new table based on the Date table where date-id is unique, and then create a many-to-many relationship to Weekly_Return.
Answer: A
NEW QUESTION 16
Note: This question is part of a series of questions that present the same scenario. Each question in the series contains a unique solution that might meet the stated goals. Some question sets might have more than one correct solution, while others might not have a correct solution.
After you answer a question in this section, you will NOT be able to return to it. As a result, these questions will not appear in the review screen.
You create a parameter named DataSourceExcel that holds the file name and location of a Microsoft Excel data source.
You need to update the query to reference the parameter instead of multiple hard-coded copies of the location within each query definition.
Solution: You add a Power Apps custom visual to the report. Does this meet the goal?
- A. Yes
- B. No
Answer: A
NEW QUESTION 17
You publish a report to a workspace named Customer Services. The report identifies customers that have potential data quality issues that must be investigated by the customer services department of your company.
You need to ensure that customer service managers can create task lists in Microsoft Excel based on the data. Which report setting should you configure?
- A. Don't allow end user to save filters on this report.
- B. Change default visual interaction from cross highlighting to cross filtering.
- C. Enable the updated filter pane, and show filters in the visual header for this report.
- D. Allow users to add comments to this report.
- E. Choose the type of data you allow your end users to export.
Answer: A
NEW QUESTION 18
You build a report to analyze customer transactions from a database that contains the tables shown in the following table.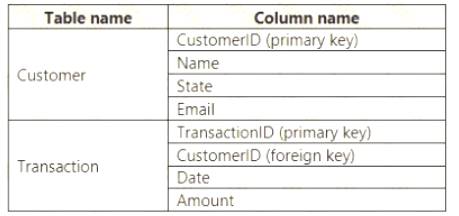
You import the tables.
Which relationship should you use to link the tables?
- A. one-to-many from Customer to Transaction
- B. one-to-one between Customer and Transaction
- C. one-to-many from Transaction to Customer
- D. many-to-many between Customer and Transaction
Answer: B
NEW QUESTION 19
You have a folder of monthly transaction extracts.
You plan to create a report to analyze the transaction data.
You receive the following email message: "Hi. I've put 24 files of monthly transaction data onto the shared drive. File Transactions202101.csv through Transactions202112.csv have the latest set of columns, but files Transactions202101.csv to Transactions202112.csv have an older layout without the extra fields needed for analysis. Each file contains 10 to 50 transactions."
You get data from the folder and select Combine & Load. The Combine Files dialog box is shown in the exhibit. (Click the Exhibit tab.)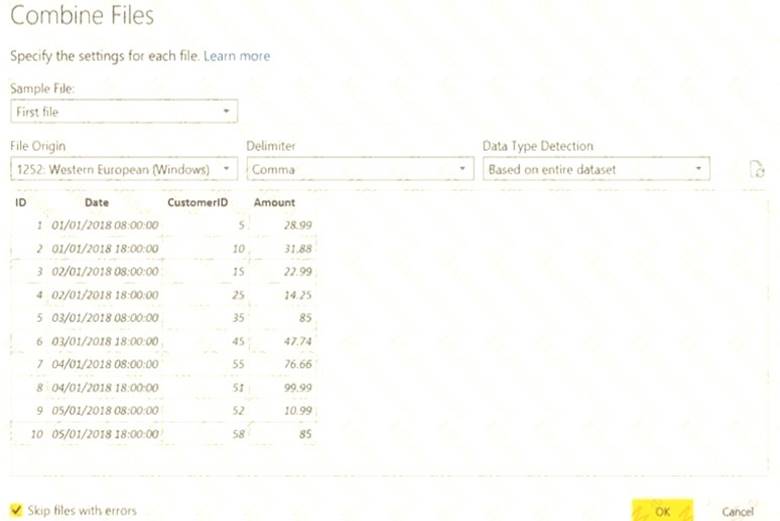
For each of the following statements, select Yes if the statement is true. Otherwise, select No. NOTE: Each correct selection is worth one point.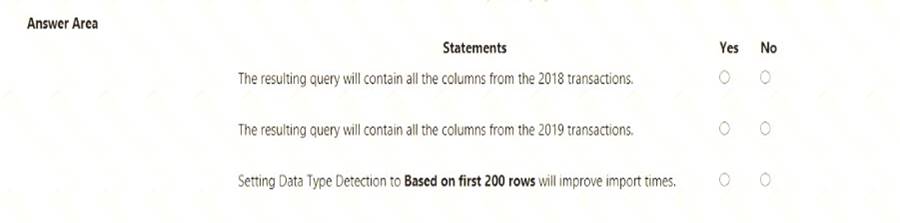
- A. Mastered
- B. Not Mastered
Answer: A
Explanation: 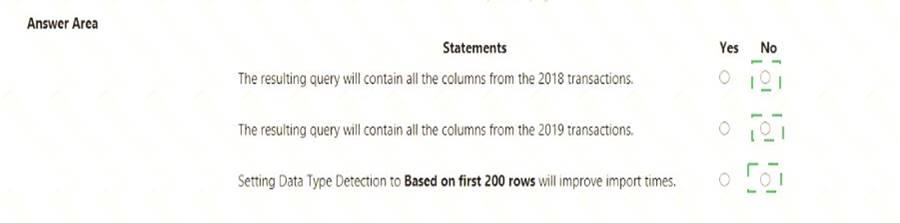
NEW QUESTION 20
......
100% Valid and Newest Version DA-100 Questions & Answers shared by Surepassexam, Get Full Dumps HERE: https://www.surepassexam.com/DA-100-exam-dumps.html (New 59 Q&As)
