Your success in Microsoft DA-100 is our sole target and we develop all our DA-100 braindumps in a way that facilitates the attainment of this target. Not only is our DA-100 study material the best you can find, it is also the most detailed and the most updated. DA-100 Practice Exams for Microsoft DA-100 are written to the highest standards of technical accuracy.
Free DA-100 Demo Online For Microsoft Certifitcation:
NEW QUESTION 1
How should you distribute the reports to the board? To answer, select the appropriate options in the answer area.
NOTE: Each correct selection is worth one point.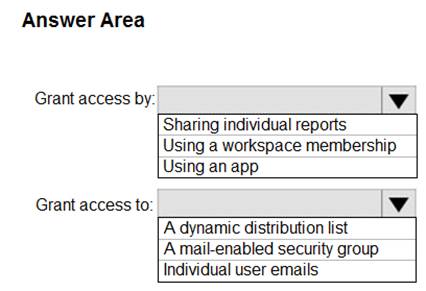
Solution:
Box 1: Using a workspace membership Scenario:
The company wants to provide a single package of reports to the board that contains custom navigation and links to supplementary information.
Note: Workspace is a shared environment for a group of people. You can have multiple Power BI content in a workspace. One workspace can have hundreds of dashboards, reports, and datasets in it.
Box 2: A mail-enabled security group Scenario: Security Requirements
The reports must be made available to the board from powerbi.com. A mail-enabled security group will be used to share information with the board.
Does this meet the goal?
- A. Yes
- B. Not Mastered
Answer: A
NEW QUESTION 2
You have the visual shown in the Original exhibit. {Click the Original tab.)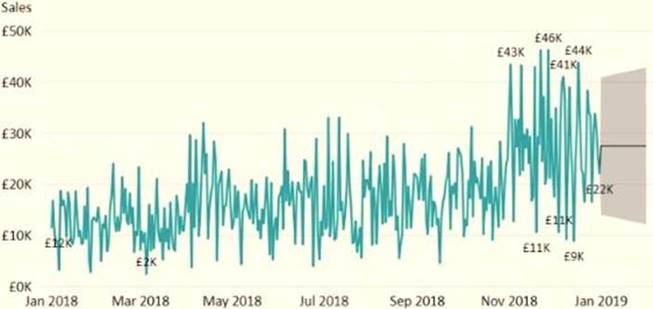
You need to configure the visual as shown in the Modified exhibit. (Click the Modified tab.)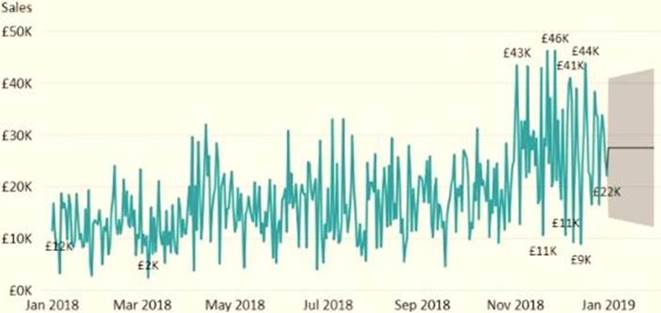
What should you add to the visual?
- A. a measure
- B. a trendline
- C. a forecast
- D. an Average line
Answer: C
Explanation:
Explore forecast results by adjusting the desired confidence interval or by adjusting outlier data to see how they affect results.
Timeline Description automatically generated with low confidence
Reference:
https://powerbi.microsoft.com/fr-fr/blog/introducing-new-forecasting-capabilities-in-power-view-for-office-365
NEW QUESTION 3
You publish a Microsoft Power BI dataset to powerbi.com. The dataset appends data from an on-premises Oracle database and an Azure SQL database by using one query.
You have admin access to the workspace and permission to use an existing On-premises data gateway for which the Oracle data source is already configured.
You need to ensure that the data is updated every morning. The solution must minimize configuration effort. Which two actions should you perform when you configure scheduled refresh? Each correct answer presents
part of the solution.
NOTE: Each correct selection is worth one point.
- A. Configure the dataset to use the existing On-premises data gateway.
- B. Deploy an On-premises data gateway in personal mode.
- C. Set the refresh frequency to Daily.
- D. Configure the dataset to use the personal gateway.
Answer: AC
Explanation:
https://docs.microsoft.com/en-us/power-bi/connect-data/service-gateway-personal-mode
NEW QUESTION 4
You have the line chart shown in the exhibit. (Click the Exhibit tab.)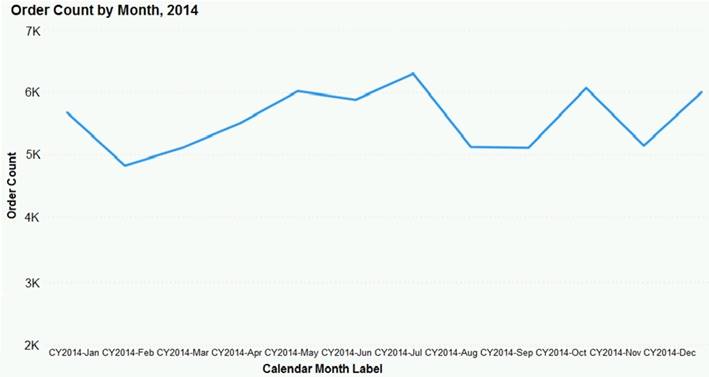
You need to modify the chart to meet the following requirements:  Identify months that have order counts above the mean. Display the mean monthly order count.
Which three actions should you perform in sequence? To answer, move the appropriate actions from the list of actions to the answer area and arrange them in the correct order.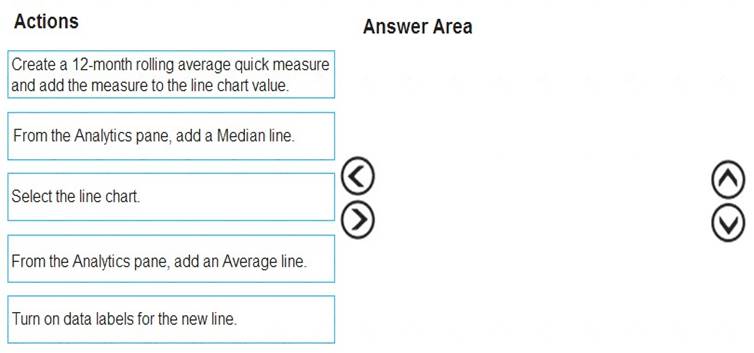
Solution:
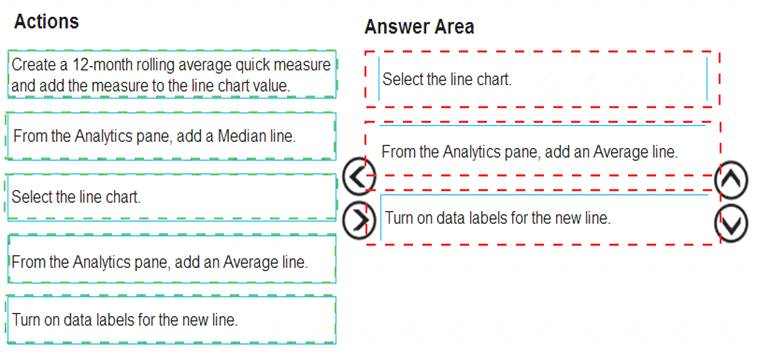
Does this meet the goal?
- A. Yes
- B. Not Mastered
Answer: A
NEW QUESTION 5
You view a query named Transactions as shown in the following exhibit.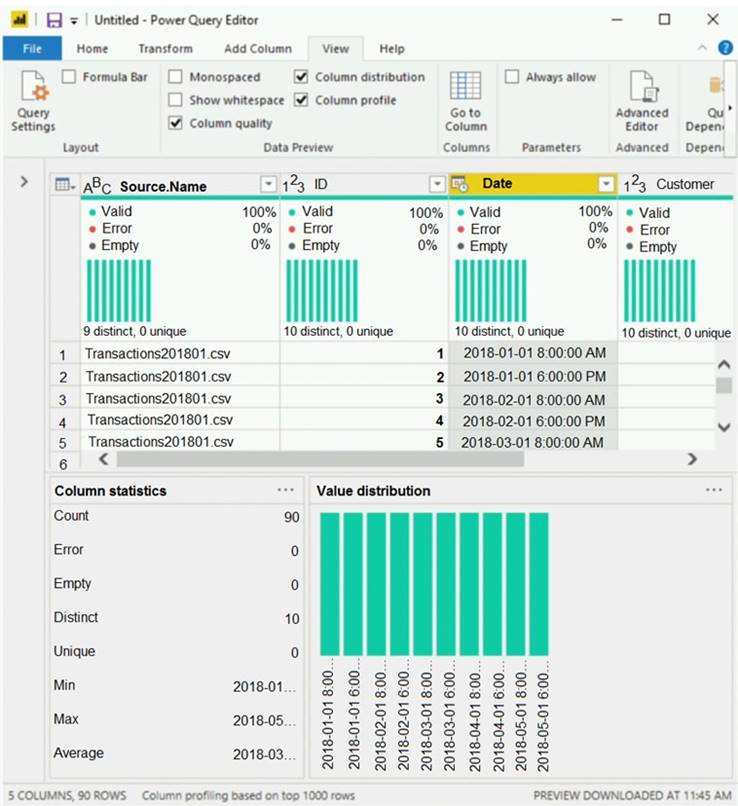
The query gets CSV files from a folder.
Use the drop-down menus to select the answer choice that completes each statement based on the information presented in the graphic.
NOTE: Each correct selection is worth one point.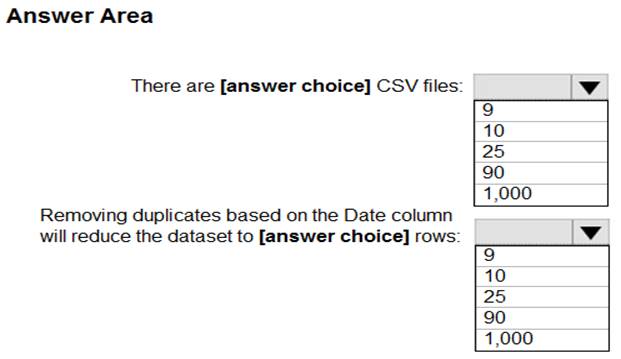
Solution:
Box 1: 9
9 distinct CSV files.
Box 2: 10
10 distinct dates.
https://pediaa.com/what-is-the-difference-between-unique-and-distinct-in-sql/#:~:text=Unique%20and%20Disti
Does this meet the goal?
- A. Yes
- B. Not Mastered
Answer: A
NEW QUESTION 6
ion have a Power BI dataset that contains a table named Temperature Readings. Temperature Readings contains the columns shown in the following table.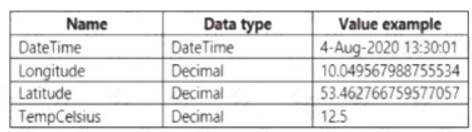
The table has 12 million rows. All the columns are needed for analysis.
You need to optimize the dataset to decrease the model size. The solution must not affect the precision of the data.
What should you do?
- A. Split the DateTime column into separate date and time columns.
- B. Disable the Power Query load.
- C. Round the Longitude column two decimal places.
- D. Change the data type of the TempCelsius column to Integer
Answer: B
Explanation:
Disable Power Query load.
Power Query queries that are intended support data integration with other queries should not be loaded to the model. To avoid loading the query to the model, take care to ensure that you disable query load in these instances.
Reference:
https://docs.microsoft.com/en-us/power-bi/guidance/import-modeling-data-reduction#disable-power-query-quer
NEW QUESTION 7
You are creating a visual to show the ranking of product categories by sales revenue.
Your company's security policy states that you cannot send data outside of your Microsoft Power Bl tenant Which approach provides the widest variety of visuals while adhering to the security policy?
- A. Use default visuals or custom visuals uploaded from a .pbiviz file.
- B. Use only default visuals.
- C. Use default or any custom visuals from the marketplace.
- D. Use default or certified custom visuals.
Answer: C
NEW QUESTION 8
Your company plans to completely separate development and production assets such as datasets, reports, and dashboards in Microsoft Power BI.
You need to recommend an application lifecycle strategy. The solution must minimize access to production assets and prevent end users from viewing the development assets.
What should you recommend?
- A. Create production reports in a separate workspace that uses a shared dataset from the development workspac
- B. Grant the end users access to the production workspace.
- C. Create one workspace for developmen
- D. From the new workspace, publish an app for production.
- E. Create a workspace for development and a workspace for productio
- F. From the production workspace, publish an app.
- G. In one workspace, create separate copies of the assets and append DEV to the names of the copied asset
- H. Grant the end users access to the workspace.
Answer: C
Explanation:
Use different work stages (Development, Test, and Production). Deploy from the Development workspace.
Reference:
https://visualbi.com/blogs/microsoft/powerbi/application-lifecycle-management-power-bi/
NEW QUESTION 9
You build a report to help the sales team understand its performance and the drivers of sales. The team needs to have a single visualization to identify which factors affect success. Which type of visualization should you use?
- A. Key influences
- B. Funnel chart
- C. Q&A
- D. Line and clustered column chart
Answer: A
Explanation:
The key influencers visual helps you understand the factors that drive a metric you're interested in. It analyzes your data, ranks the factors that matter, and displays them as key influencers.
The key influencers visual is a great choice if you want to: See which factors affect the metric being analyzed. Contrast the relative importance of these factors. For example, do short-term contracts have more impact on churn than long-term contracts?
Reference:
https://docs.microsoft.com/en-us/power-bi/visuals/power-bi-visualization-influencers
NEW QUESTION 10
You have a Power BI report.
You need to create a calculated table to return the 100 highest spending customers.
How should you complete the DAX expression? To answer, select the appropriate options in the answer area.
NOTE: Each correct selection is worth one point.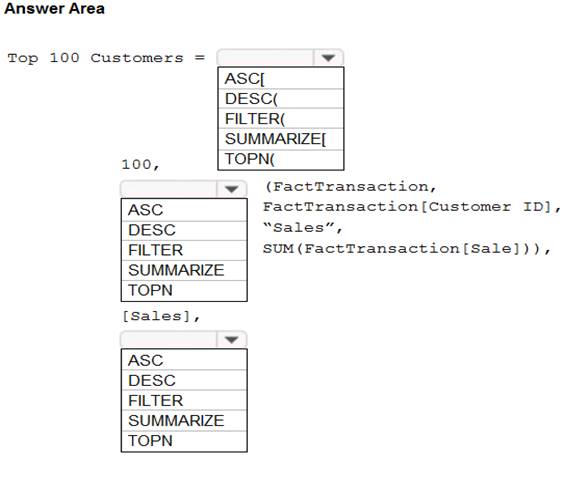
Solution:
Box 1: TOPN
TOPN returns the top N rows of the specified table. Box 2: SUMMARIZE
SUMMARIZE returns a summary table for the requested totals over a set of groups. Box 3: DESC
Sort in descending order.
It is last in the TOPN command. TOPN syntax:
TOPN(<n_value>, <table>, <orderBy_expression>, [<order>[, <orderBy_expression>, [<order>]]…]) Reference:
https://docs.microsoft.com/en-us/dax/topn-function-dax https://docs.microsoft.com/en-us/dax/summarize-function-dax
Does this meet the goal?
- A. Yes
- B. Not Mastered
Answer: A
NEW QUESTION 11
You need to create a calculated column to display the month based on the reporting requirements. Which DAX expression should you use?
- A. FORMAT('Date'[date], "MMM YYYY")
- B. FORMAT('Date' [date], "M YY")
- C. FORMAT('Date'[date_id], "MMM") & "" & FORMAT('Date'[year], "#")
- D. FORMAT('Date' [date_id], "MMM YYYY")
Answer: A
NEW QUESTION 12
You have a Microsoft Power Bl dashboard. The report used to create the dashboard uses an imported dataset from a Microsoft SQL Server data source. The dashboard is shown in the exhibit. (Click the Exhibit tab.)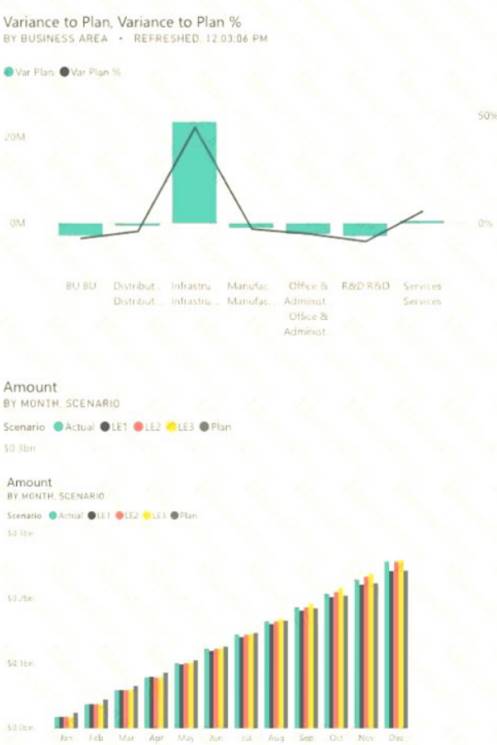
What occurred at 12:03:06 PM?
- A. A user pressed F5
- B. A new transaction was added to the data source.
- C. A user added a comment to a tile.
- D. The dashboard tile cache refreshed.
Answer: D
Explanation:
Reference:
https://docs.microsoft.com/en-us/power-bi/connect-data/refresh-data
NEW QUESTION 13
Which DAX expression should you use to get the ending balances in the balance sheet reports?
- A. CALCULATE (SUM( BalanceSheet [BalanceAmount] ), DATESQTD( 'Date'[Date] ))
- B. CALCULATE (SUM( BalanceSheet [BalanceAmount] ), LASTDATE( 'Date'[Date] ))
- C. FIRSTNONBLANK ( 'Date' [Date]SUM( BalanceSheet[BalanceAmount] ))
- D. CALCULATE (MAX( BalanceSheet[BalanceAmount] ), LASTDATE( 'Date' [Date] ))
Answer: A
Explanation:
Scenario: At least one of the balance sheet reports in the quarterly reporting package must show the ending balances for the quarter, as well as for the previous quarter.
DATESQTD returns a table that contains a column of the dates for the quarter to date, in the current context. Reference:
https://docs.microsoft.com/en-us/dax/datesqtd-function-dax
NEW QUESTION 14
Note: This question is part of a series of questions that present the same scenario. Each question in the series contains a unique solution that might meet the stated goals. Some question sets might have more than one correct solution, while others might not have a correct solution.
After you answer a question in this scenario, you will NOT be able to return to it. As a result, these questions will not appear in the review screen.
You have a clustered bar chart that contains a measure named Salary as the value and a field named Employee as the axis. Salary is present in the data as numerical amount representing US dollars.
You need to create a reference line to show which employees are above the median salary. Solution: You create a percentile line by using the Salary measure and set the percentile to 50%. Does this meet the goal?
- A. Yes
- B. No
Answer: A
Explanation:
The 50th percentile is also known as the median or middle value where 50 percent of observations fall below. Reference:
https://dash-intel.com/powerbi/statistical_functions_percentile.php
NEW QUESTION 15
Note: This question is part of a series of questions that present the same scenario. Each question in the series contains a unique solution that might meet the stated goals. Some question sets might have more than one correct solution, while others might not have a correct solution.
After you answer a question in this scenario, you will NOT be able to return to it. As a result, these questions will not appear in the review screen.
You have several reports and dashboards in a workspace.
You need to grant all organizational users read access to a dashboard and several reports. Solution: You assign all the users the Viewer role to the workspace.
Does this meet the goal?
- A. Yes
- B. No
Answer: A
Explanation:
The Viewer role gives a read-only experience to its users. They can view dashboards, reports, or workbooks in the workspace, but can’t browse the datasets or dataflows. Use the Viewer role wherever you would previously use a classic workspace set to “Members can only view Power BI content”.
Reference:
https://powerbi.microsoft.com/en-us/blog/announcing-the-new-viewer-role-for-power-bi-workspaces/
NEW QUESTION 16
You have a Power BI tenant.
You have reports that use financial datasets and are exported as PDF files. You need to ensure that the reports are encrypted.
What should you implement?
- A. dataset certifications
- B. row-level security (RLS)
- C. sensitivity labels
- D. Microsoft Intune policies
Answer: C
Explanation:
General availability of sensitivity labels in Power BI.
Microsoft Information Protection sensitivity labels provide a simple way for your users to classify critical content in Power BI without compromising productivity or the ability to collaborate. Sensitivity labels can be applied on datasets, reports, dashboards, and dataflows. When data is exported from Power BI to Excel, PowerPoint or PDF files, Power BI automatically applies a sensitivity label on the exported file and protects it according to the label’s file encryption settings. This way your sensitive data remains protected no matter where it is.
Reference:
https://powerbi.microsoft.com/en-us/blog/announcing-power-bi-data-protection-ga-and-introducing-new-capabil
NEW QUESTION 17
You import two Microsoft Excel tables named Customer and Address into Power Query. Customer contains the following columns: Customer ID Customer Name
  Phone Email Address Address ID
Address contains the following columns: Address ID Address Line 1 Address Line 2 City State/Region Country Postal Code
The Customer ID and Address ID columns represent unique rows.
You need to create a query that has one row per customer. Each row must contain City, State/Region, and Country for each customer.
What should you do?
- A. Merge the Customer and Address tables.
- B. Transpose the Customer and Address tables.
- C. Group the Customer and Address tables by the Address ID column.
- D. Append the Customer and Address tables.
Answer: A
Explanation:
There are two primary ways of combining queries: merging and appending. When you have one or more columns that you’d like to add to another query, you merge the queries. When you have additional rows of data that you’d like to add to an existing query, you append the query.
Reference:
https://docs.microsoft.com/en-us/power-bi/connect-data/desktop-shape-and-combine-data
NEW QUESTION 18
In Power BI Desktop, you are building a sales report that contains two tables. Both tables have row-level security (RLS) configured.
You need to create a relationship between the tables. The solution must ensure that bidirectional cross-filtering honors the RLS settings.
What should you do?
- A. Create an active relationship between the tables and select Assume referential integrity.
- B. Create an inactive relationship between the tables and select Assume referential integrity.
- C. Create an inactive relationship between the tables and select Apply security filter in both directions.
- D. Create an active relationship between the tables and select Apply security filter in both directions.
Answer: D
Explanation:
By default, row-level security filtering uses single-directional filters, whether the relationships are set to single direction or bi-directional. You can manually enable bi-directional cross-filtering with row-level security by selecting the relationship and checking the Apply security filter in both directions checkbox. Select this option when you've also implemented dynamic row-level security at the server level, where row-level security is based on username or login ID.
Graphical user interface, application, Word Description automatically generated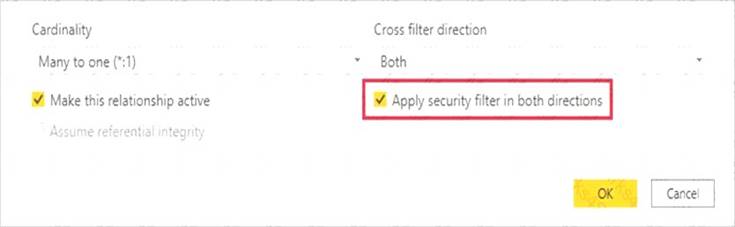
Reference:
https://docs.microsoft.com/en-us/power-bi/admin/service-admin-rls
NEW QUESTION 19
You are building a dataset from a JSON file that contains an array of documents.
You need to import attributes as columns from all the documents in the JSON file. The solution must ensure that date attributes can be used as date hierarchies in Microsoft Power BI reports.
Which three actions should you perform in sequence? To answer, move the appropriate actions from the list of actions to the answer area and arrange them in the correct order.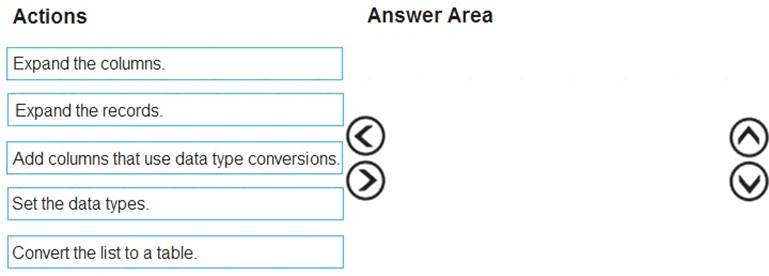
Solution:
Here is an example: https://youtu.be/B4kzyxnhQfI The definition of the function which expand columns:
https://docs.microsoft.com/en-us/powerquery-m/table-expandrecordcolumn
Does this meet the goal?
- A. Yes
- B. Not Mastered
Answer: A
NEW QUESTION 20
......
P.S. DumpSolutions.com now are offering 100% pass ensure DA-100 dumps! All DA-100 exam questions have been updated with correct answers: https://www.dumpsolutions.com/DA-100-dumps/ (141 New Questions)
